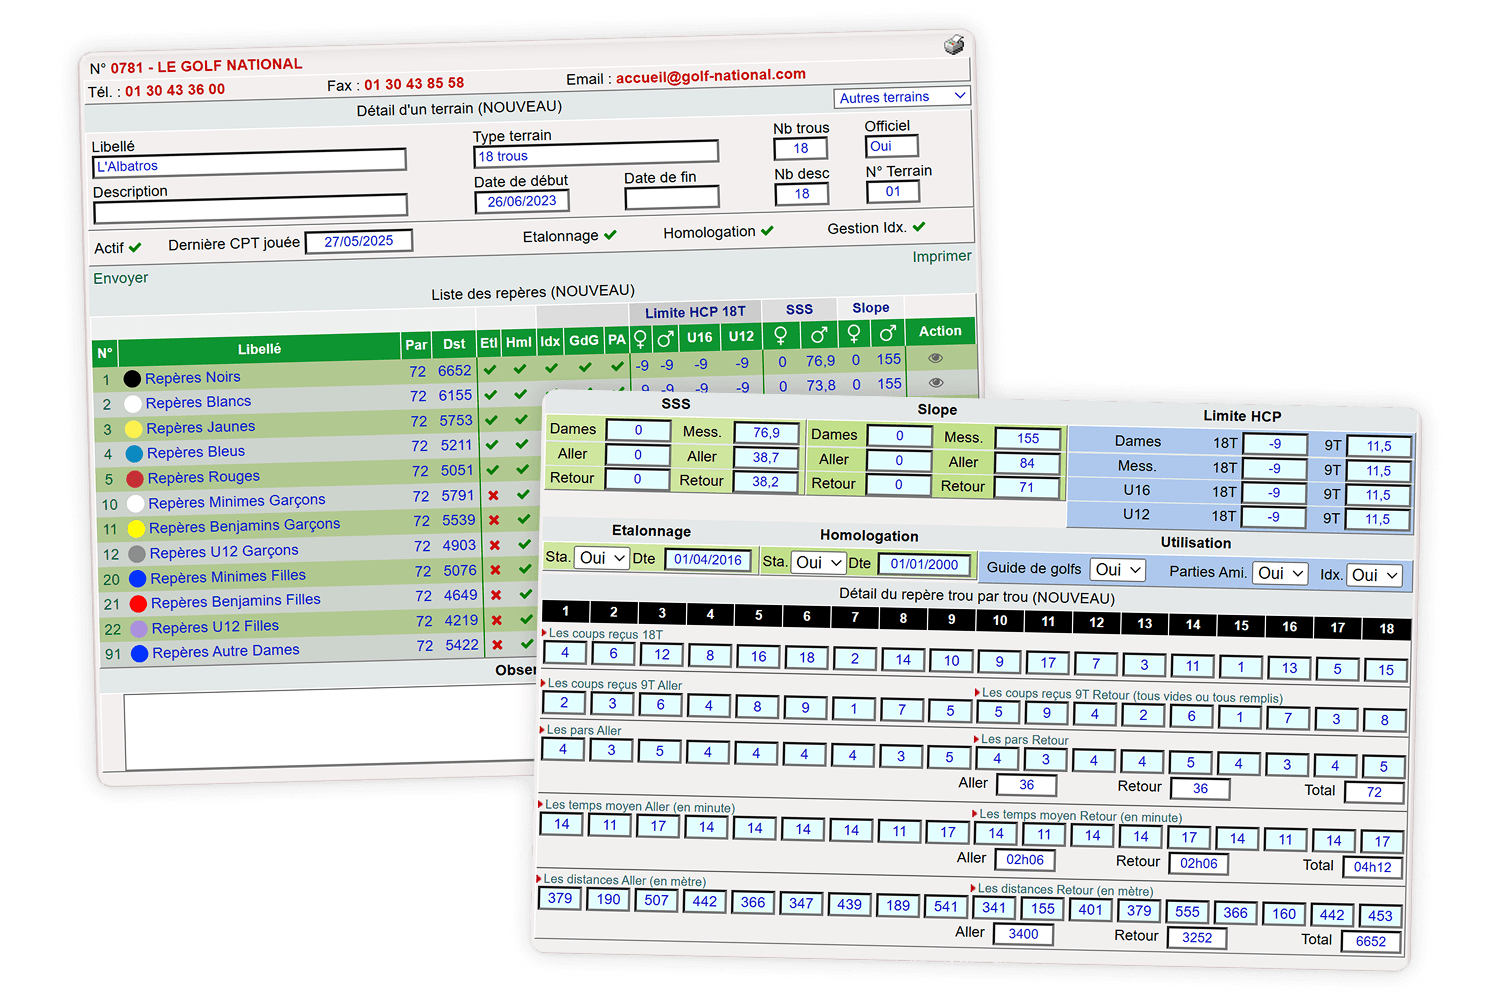
A 20-year-old tool behind every round
In golf, you play less against your opponents than against the course. Every player has a handicap indexA golfer’s playing level, calculated from their best recent scores. The lower it is, the better the player., their average level of play. Every hole offers several teesThe starting area of a hole, identified by a colour. Each colour matches a distance suited to a level or category of players., starting points of different colours depending on the level. And each teeThe starting area of a hole, identified by a colour. Each colour matches a distance suited to a level or category of players. has its own difficulty, measured by the SSSThe score a very skilled player (index 0) is expected to shoot on the course, from a given tee. and the SlopeHow hard the course is for an average player compared with a very skilled one. It ranges from 55 to 155, with 113 being standard difficulty.. After each round, the score is compared to this course data to update the indexA golfer’s playing level, calculated from their best recent scores. The lower it is, the better the player..
Wrong course data means wrong indexesA golfer’s playing level, calculated from their best recent scores. The lower it is, the better the player. for every player who teed off there.
This data covers 1,100 courses, 500 clubs and 400,000 licensed players. It lived in a business tool more than 20 years old, used by both the clubs and the federation.
My initial brief was to modernise the interface, without touching the data structure.
What the business teams taught us
Starting from scratch
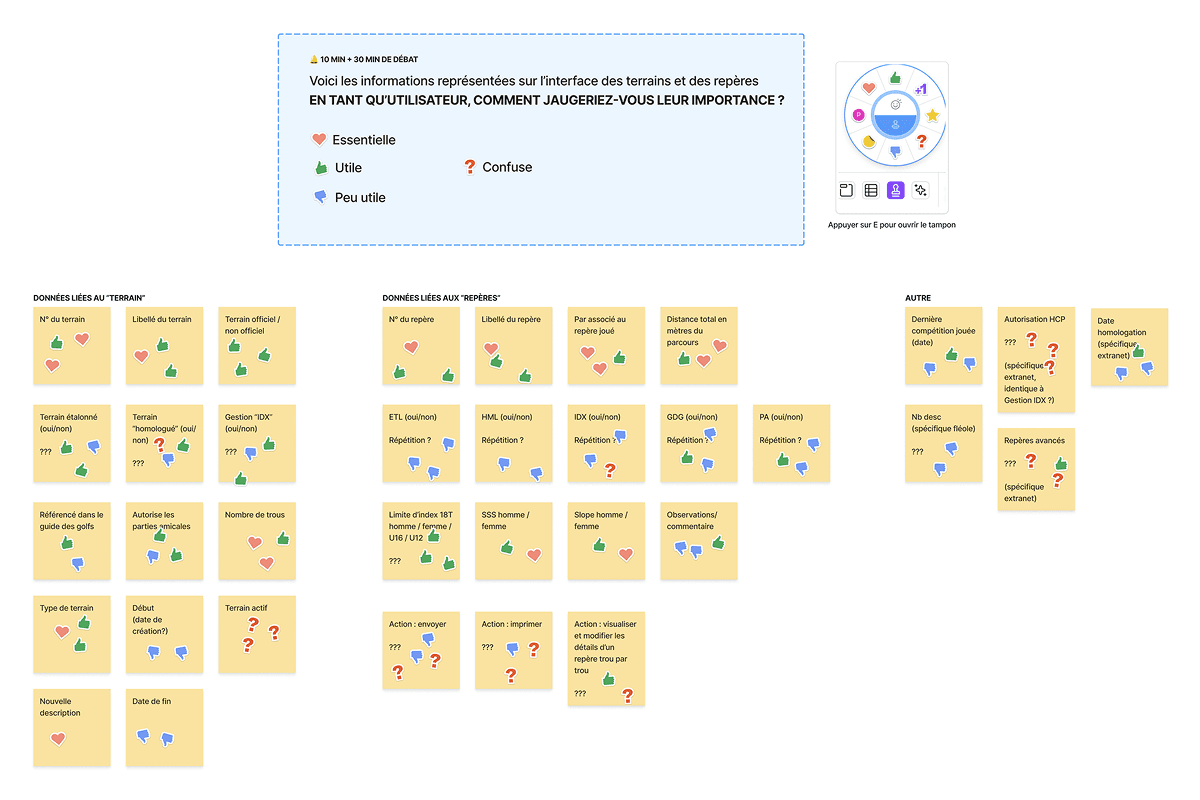
There was no documentation on how the tool worked. To question 20 years of features, I chose visual, progressive formats that could cover a lot of ground in little time.



I then analysed the votes and prioritised each piece of information by how critical it was and how much it mattered for the MVP.
A problem hidden beneath the interface
While working on this data, I realised that some courses were actually made up of other courses (a front nine, a back nine, a layout mixing two 18-hole courses), and that each time, their data was copied over. The same went for junior teesThe starting area of a hole, identified by a colour. Each colour matches a distance suited to a level or category of players., which borrow other teesThe starting area of a hole, identified by a colour. Each colour matches a distance suited to a level or category of players.' starting points depending on the hole.
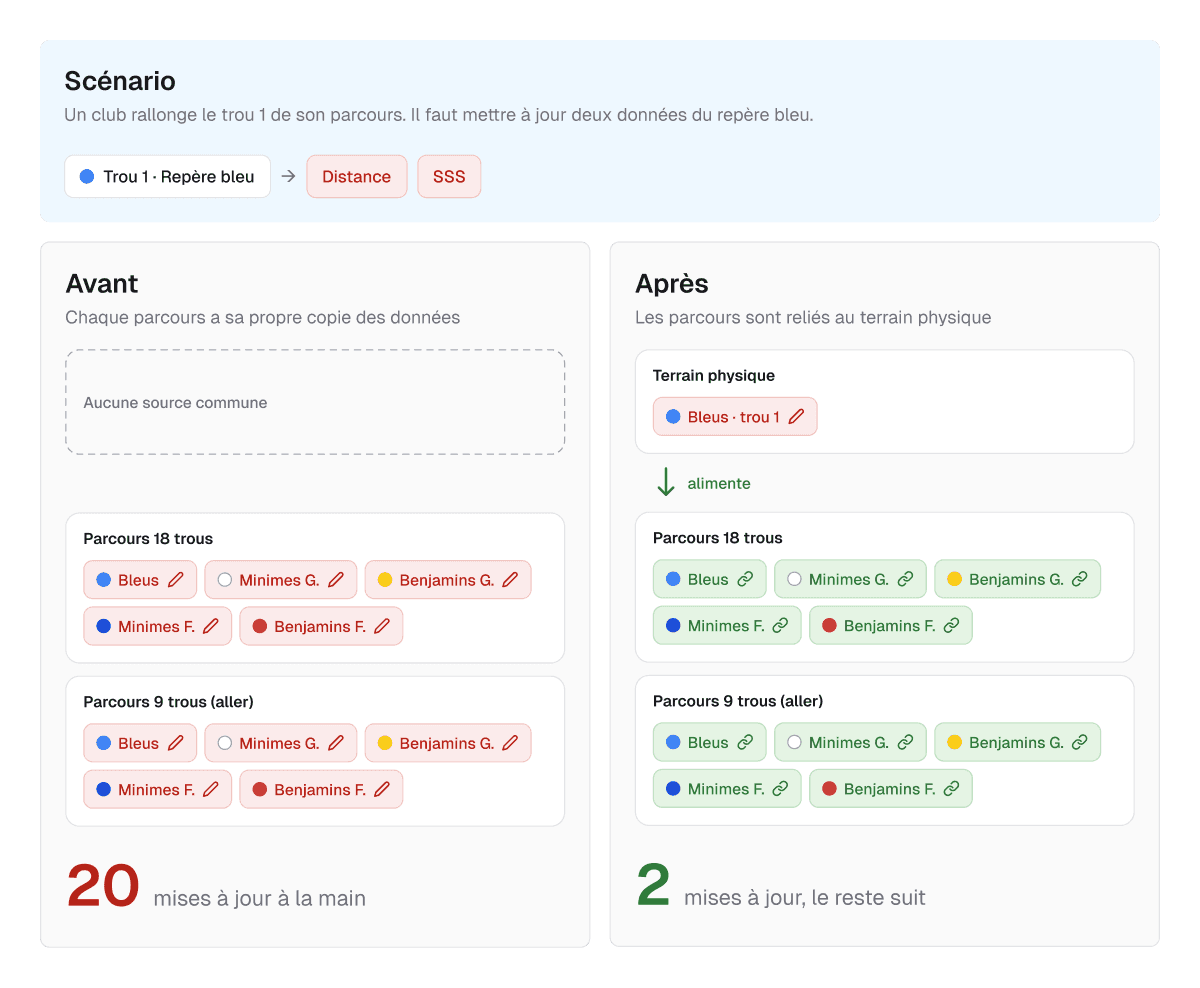
Lengthening a single hole meant the courses team had to update around twenty fields by hand, in every copy. A single oversight was enough to skew the indexesA golfer’s playing level, calculated from their best recent scores. The lower it is, the better the player..
Insight
Redesigning the interface without touching this structure would have meant repainting a tool that would keep producing errors.
Rethinking courses with the people who manage them
Starting from the same data
I saw an opportunity to base all these courses on the same data. I proposed splitting them into two objects and getting rid of the copies.



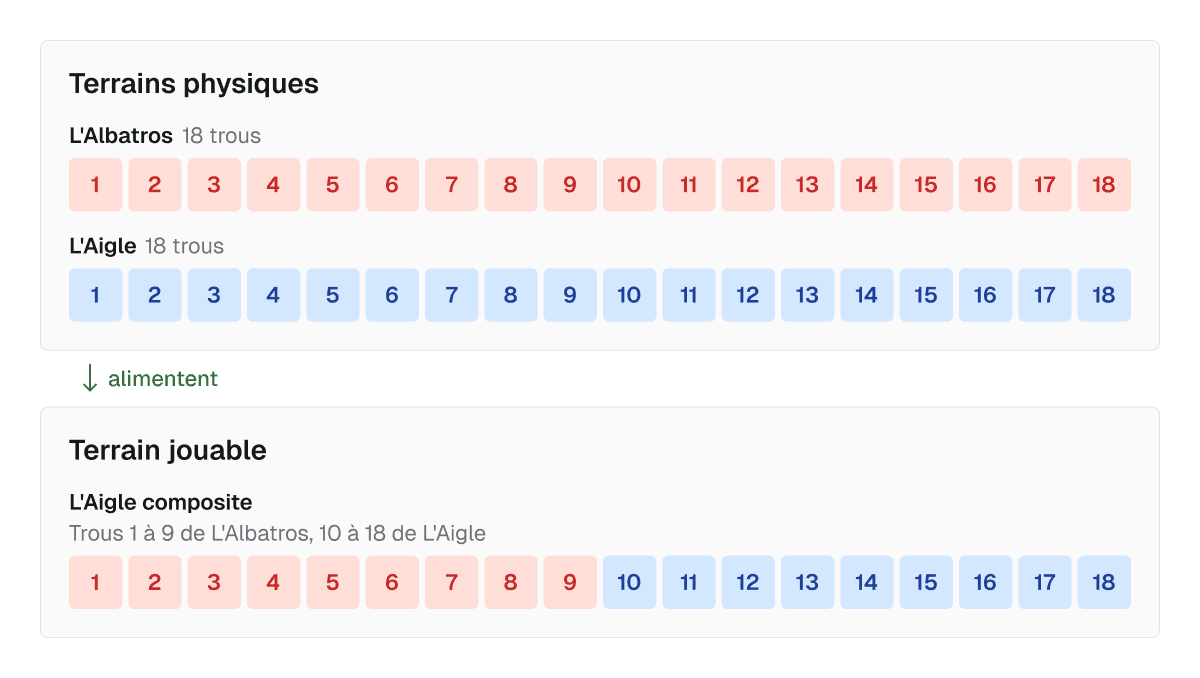
Lengthening a hole now takes 2 updates instead of about twenty. Every course and teeThe starting area of a hole, identified by a colour. Each colour matches a distance suited to a level or category of players. that uses it follows automatically.
Convincing, together
The PO shared this vision. The obstacle was technical, since the courses of all 500 clubs had to be remapped. We presented the proposal to the business teams with this diagram and the Golf National example comparing both models, then opened a discussion where everyone could share their view.
To justify such an effort, we also had to prove that the need was real on the ground. I designed a survey sent to every club with a course, through the federation's official channels.
- 133 out of 143 respondents understood the new model from a simple diagram
- 105 saw it as a way to create fun variations, 78 as a way to adapt their layout during works
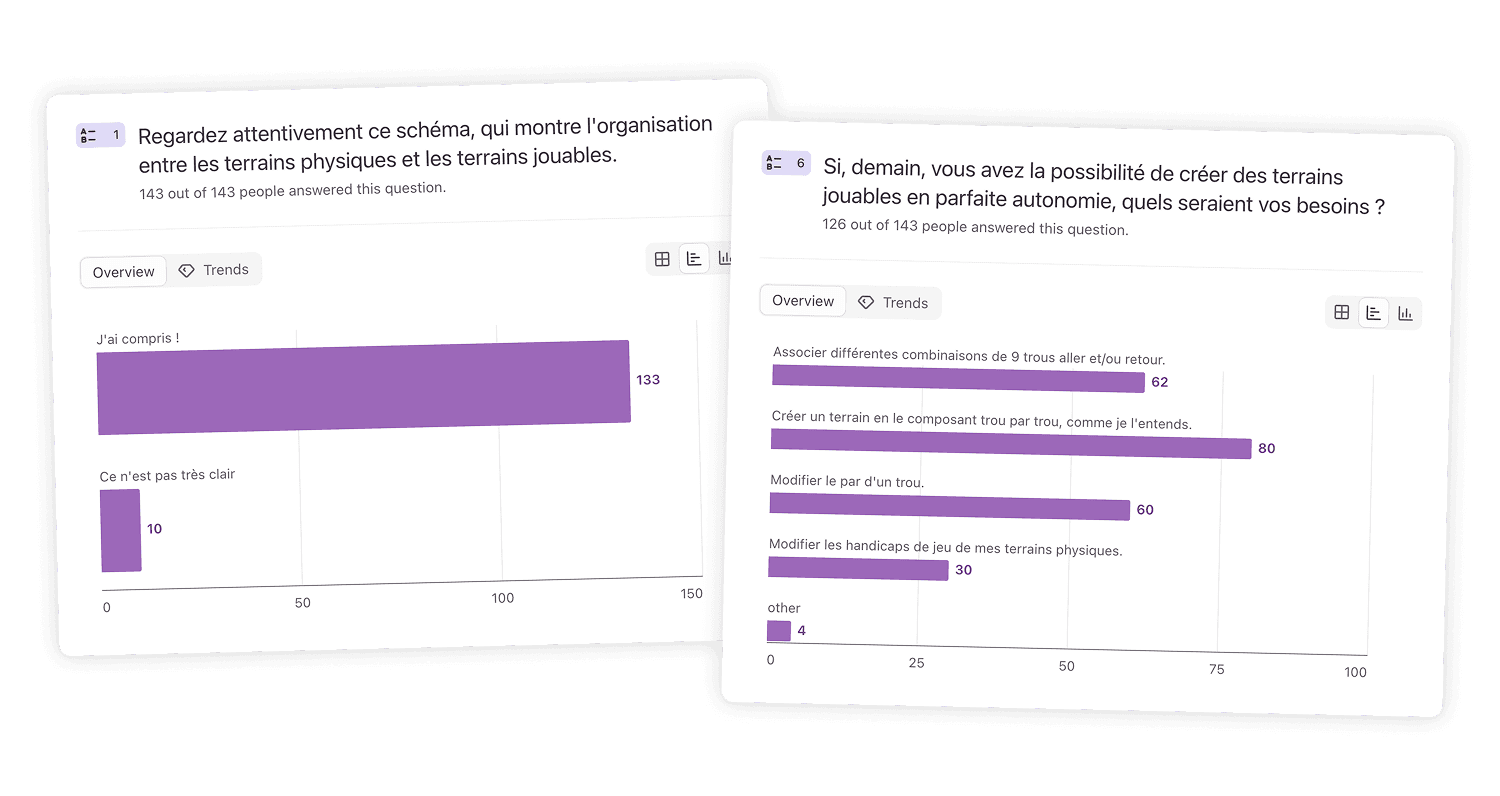
These answers confirmed the decision and made the case for the technical effort. On the federation side, the course manager summed it up simply.
"If clubs can create whatever playable coursesA layout made up of holes from physical courses, on which a round is played. they want, that takes a huge load off me."
Where does each piece of data live?
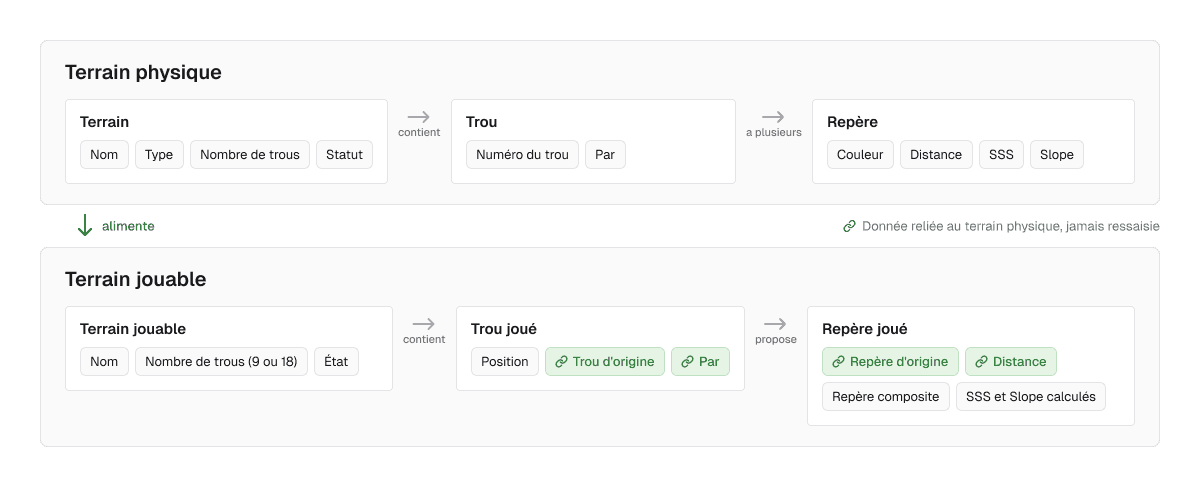
Splitting the courses meant deciding at which level to store each piece of information. With the PO, I built a simplified data model, which the back-end developers then detailed.
- The course holds what describes it as a whole (name, type, number of holes, status)
- The hole holds what doesn't change from one tee to another (number, par)
- The teeThe starting area of a hole, identified by a colour. Each colour matches a distance suited to a level or category of players. holds what depends on the starting point (distance, SSSThe score a very skilled player (index 0) is expected to shoot on the course, from a given tee., SlopeHow hard the course is for an average player compared with a very skilled one. It ranges from 55 to 155, with 113 being standard difficulty.)
This work eliminated 6 redundant fields and removed 4 unused fields spotted during the card sorting.
Making the model obvious for clubs
The new model was more accurate, but more abstract. My design choices aimed to make it feel natural for users who don't think in terms of physicalAll the holes that actually exist on a club’s site. and playable coursesA layout made up of holes from physical courses, on which a round is played..
On the federation side, creating a physical course
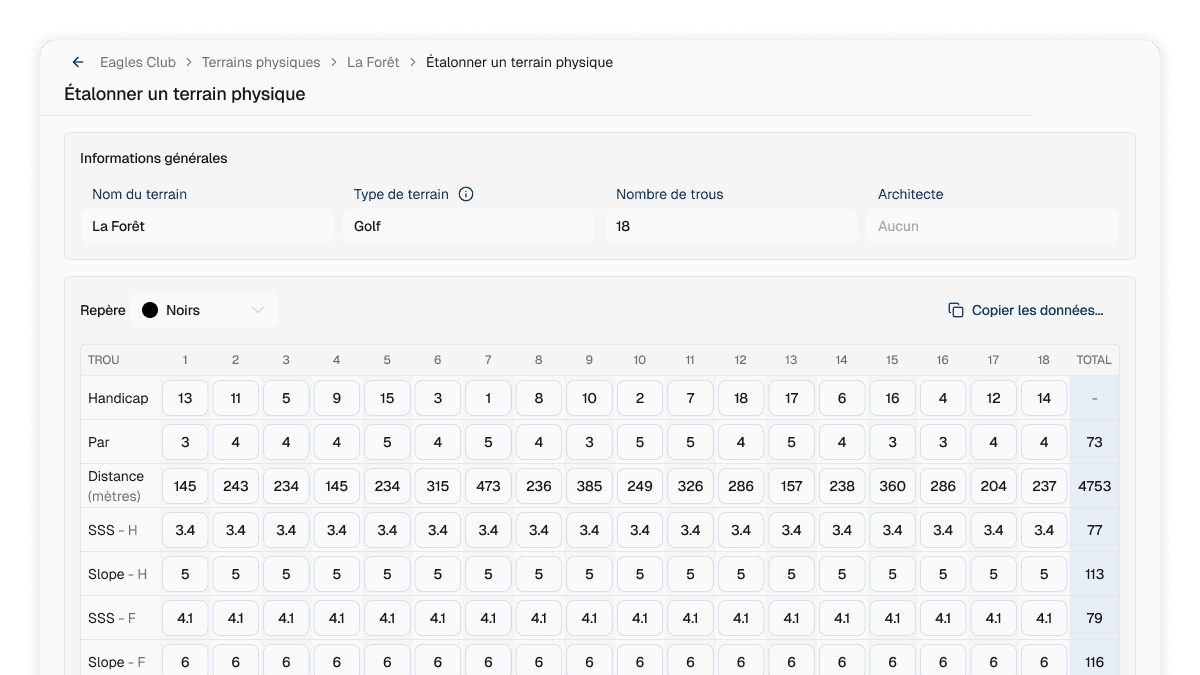
During the interviews, I watched the course manager copy the same values over and over from one teeThe starting area of a hole, identified by a colour. Each colour matches a distance suited to a level or category of players. to another. When creating a course, he can now import data from another teeThe starting area of a hole, identified by a colour. Each colour matches a distance suited to a level or category of players., in full or field by field.
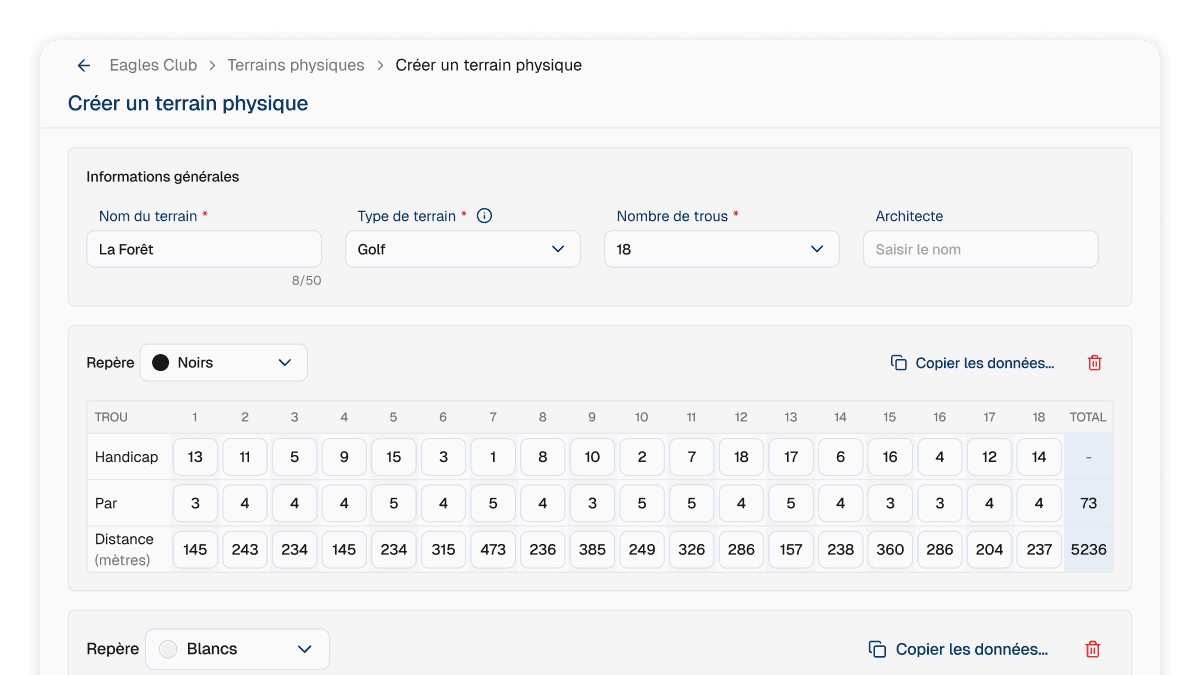
Hole-by-hole SSSThe score a very skilled player (index 0) is expected to shoot on the course, from a given tee. and SlopeHow hard the course is for an average player compared with a very skilled one. It ranges from 55 to 155, with 113 being standard difficulty. are measured on site. So I removed them from course creation, where theoretical values apply automatically, and kept them for course ratingA precise on-site measurement of a course, which sets its SSS and Slope values hole by hole..
On the club side, building a playable course
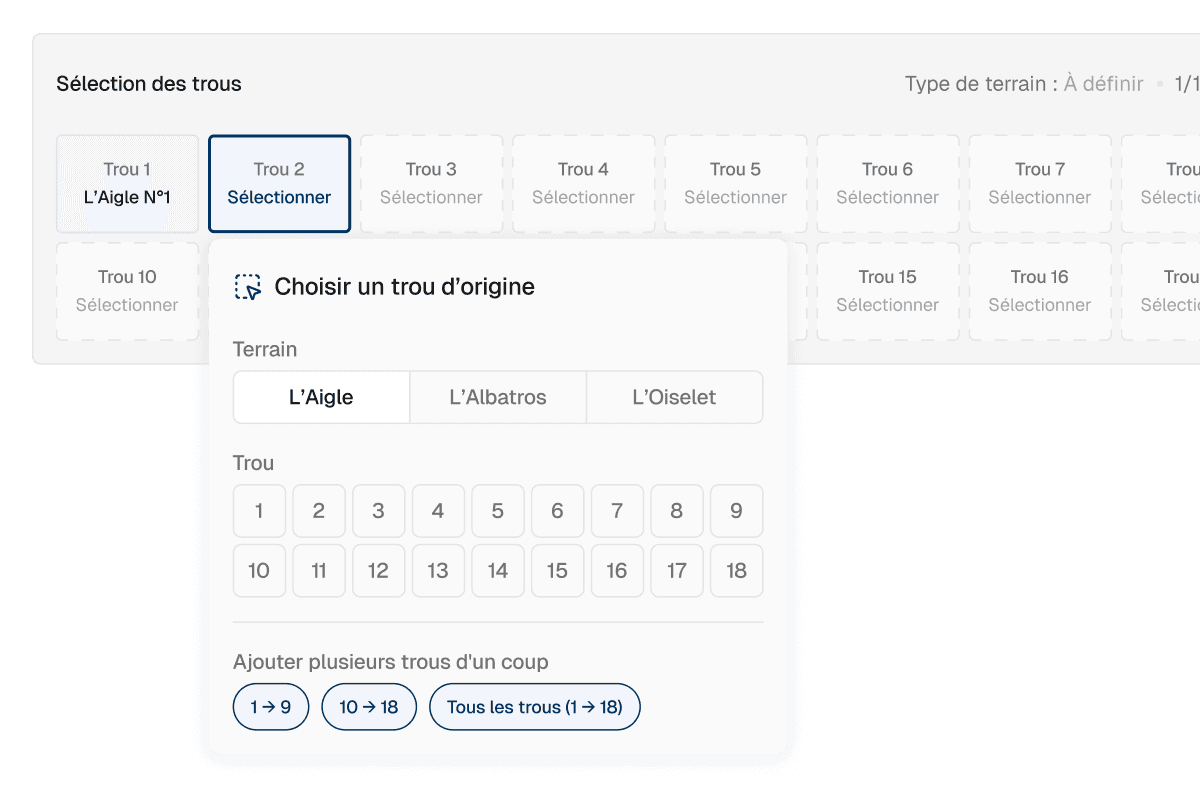
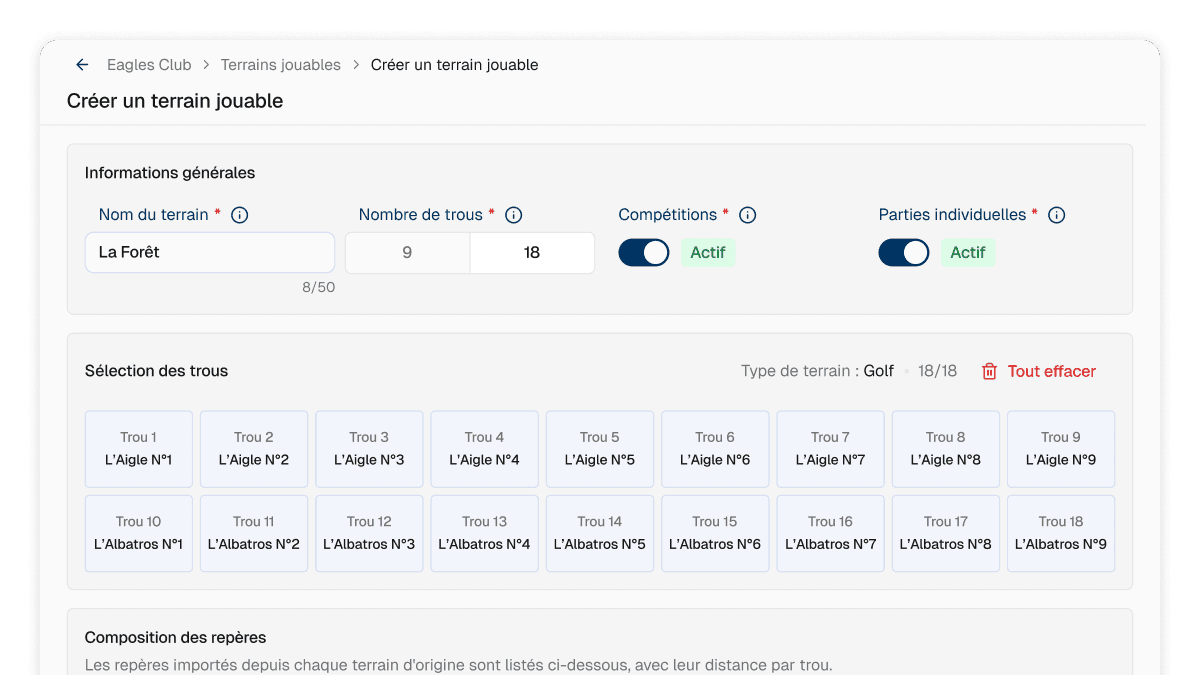
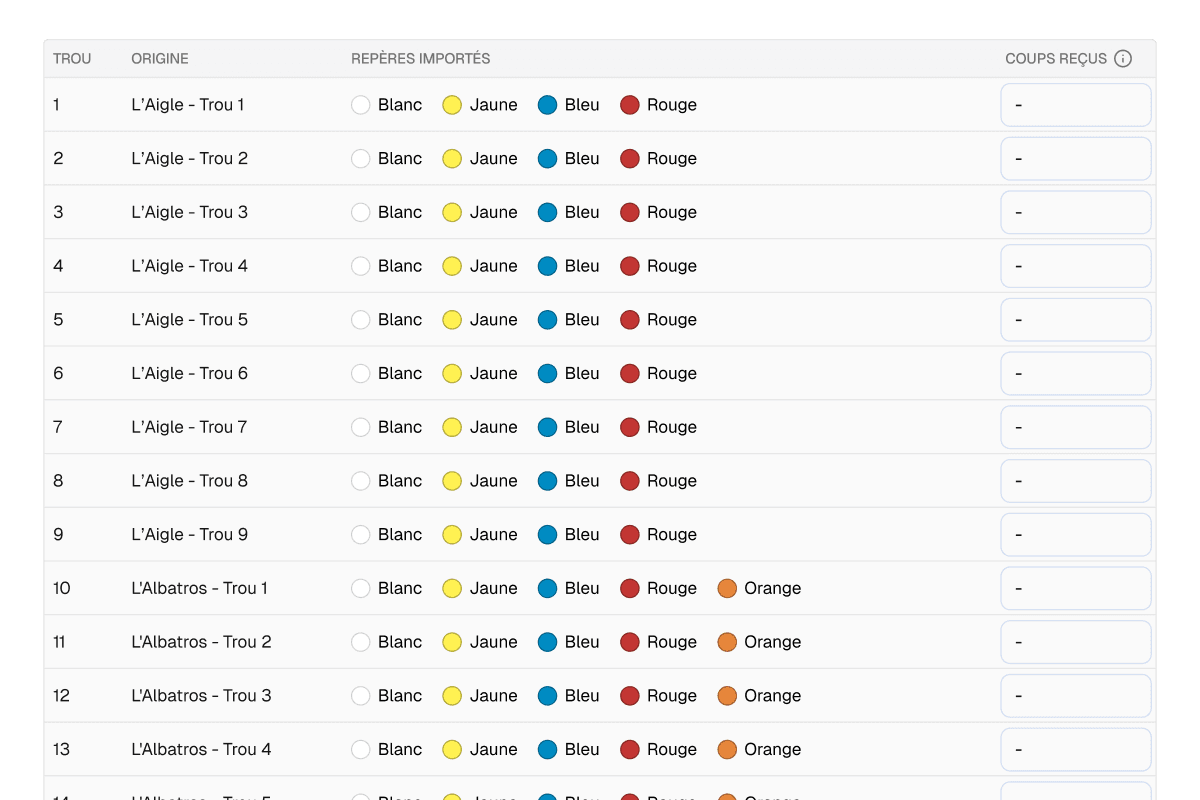
The club no longer re-enters anything. It picks each hole from its physical coursesAll the holes that actually exist on a club’s site., and the teesThe starting area of a hole, identified by a colour. Each colour matches a distance suited to a level or category of players. come in automatically with their distances.
Testing in real conditions
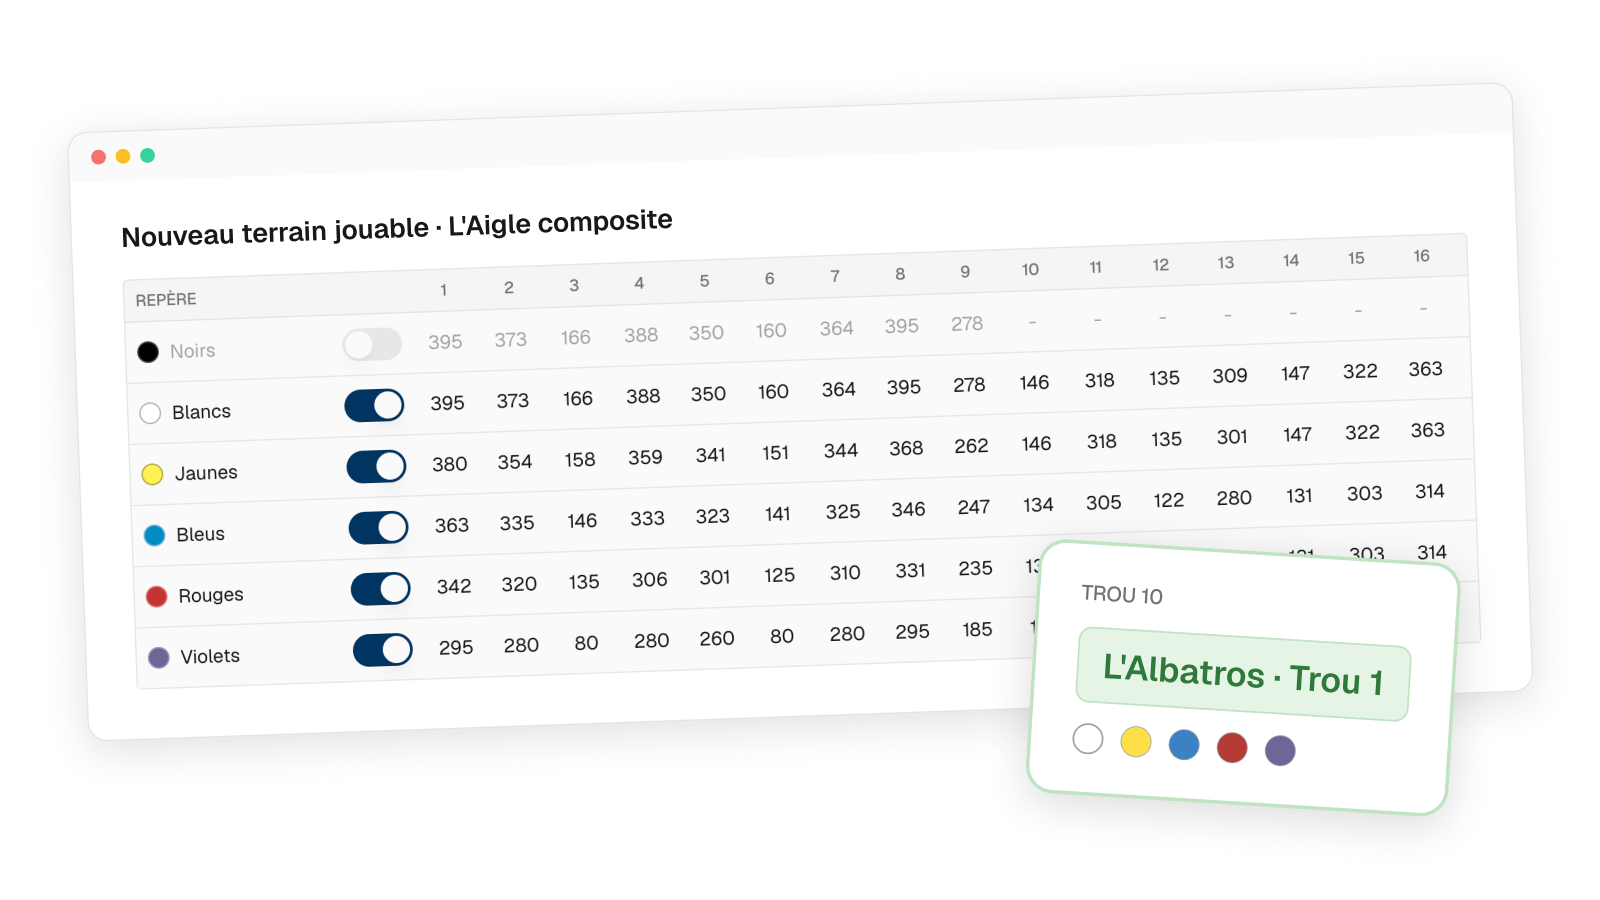
A flow this rich in interactions was impossible to test on a regular Figma mockup. So I vibe coded interactive prototypes with Claude Design, showing live how the holes of a physical courseAll the holes that actually exist on a club’s site. end up in a playable courseA layout made up of holes from physical courses, on which a round is played..
The method
- 7 moderated 45-minute tests, remote or in person
- 3 club managers and 4 internal staff (sports department and support)
- Creation flows to follow, with targeted questions on certain actions to understand people's choices
What the tests changed



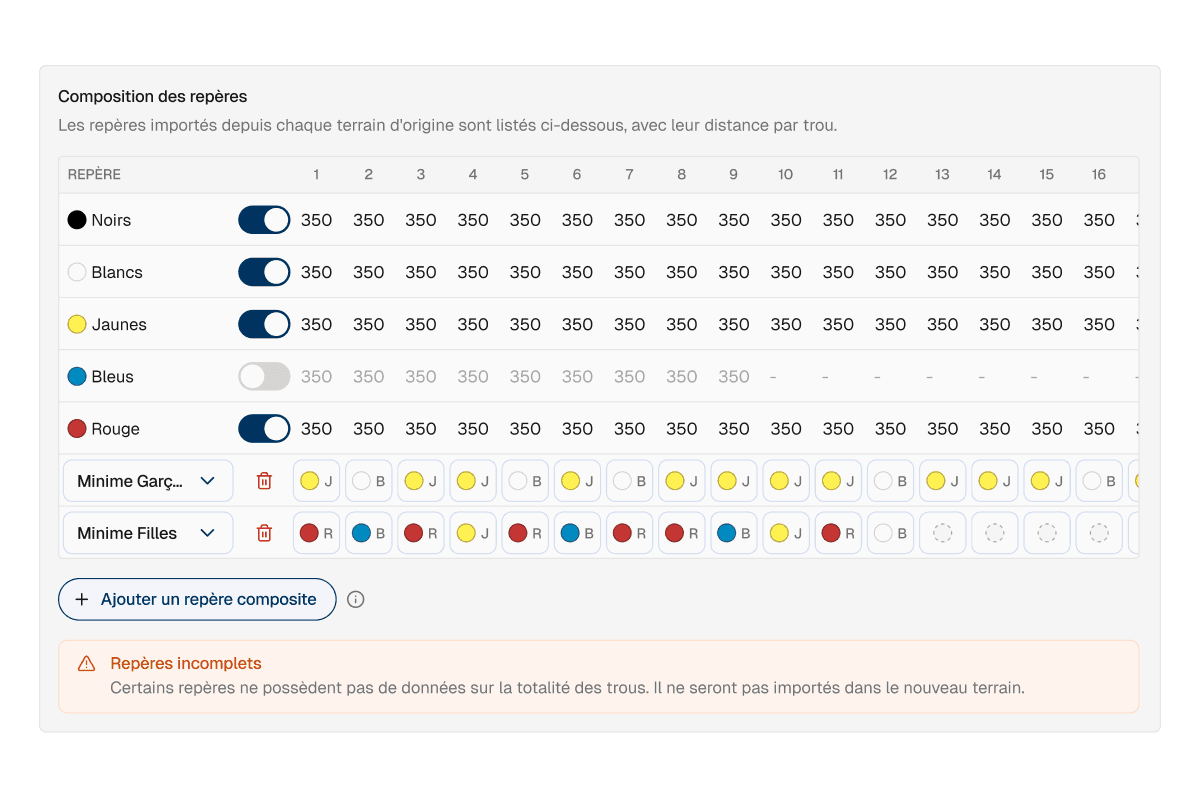
The feedback
Feedback was unanimously positive, with reactions like "This is great" or "If we get this, it changes everything". A federation manager who was sceptical at first put it this way.
"Honestly, well done, you managed to make a really unclear topic clear. I was very sceptical, I wondered how we'd keep something understandable for clubs with that much complexity. And in the end, the interface solves that problem."
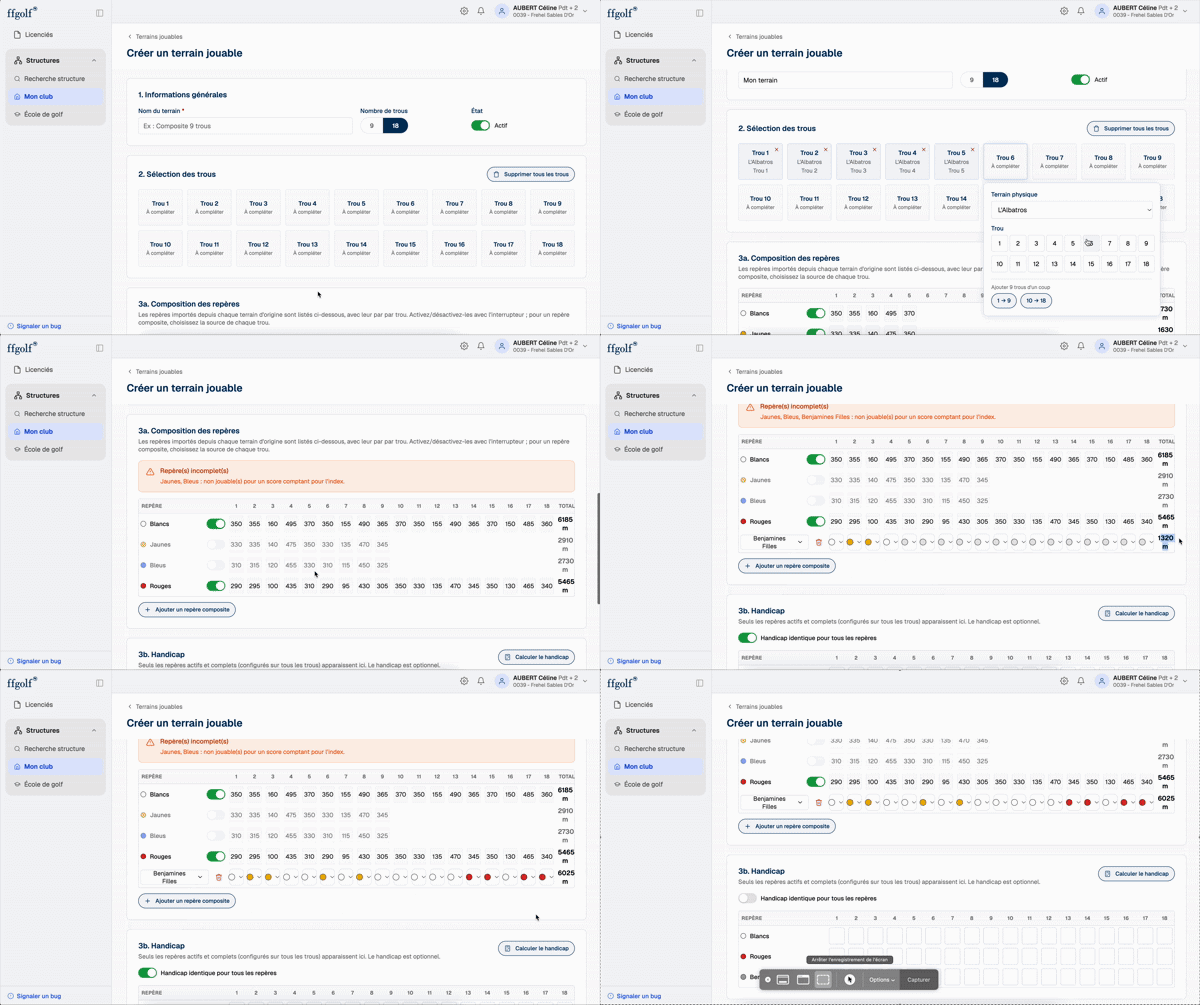
Outcomes
The redesign is delivered and in testing, ahead of its production release. Two improvements are already lined up.


What I take away
I was asked to modernise some screens. By listening to the business teams, I understood that the errors they fixed every week came from much further down, from the way the data was organised. This project taught me to look beneath the interface before designing, and to defend an idea that went beyond the brief when it addressed the real problem.